Gregory B. Searle is a digital computer artist with a Bachelor in Fine Arts
from the University of Lowell (now U-Mass at Lowell) and a computer
programming background. He combines these seemingly opposing skill-sets
to create unique computer-generated “fractal” imagery using his own
custom computer code. This allows him to explore a whole world of
mathematically-generated imagery, carefully crafting the limitless
parameters to produce one-of-a-kind, high-quality fractal prints.
At this time he is exploring trigonometric variations of the Mandelbrot,
Tower of Powers, and Newton fractals at various real exponents.
The combination of formulas, trig functions, fractional exponents, and different
rendering techniques provides a limitless world of form and texture to explore.
The expressive forms that emerge are enhanced by low-saturation or purely grayscale
color schemes, highlighting shading, texture, and motion.
About this Site
This page is intended as a space to explore computer-generated fractal
imagery as an art form. See the About Fractals page for more information.
For frequent updates, works-in-progress, and other interesting items, see the
Fractal Art and Design
page on Facebook.
Site Index
About Fractals provides more information on this medium.
Gallery shows finished works that I have printed for sale.
Fractal Everywhere is a link to the tool I built to explore and create.
Math & Art goes into more detail on various subjects.
Resources lists other pages of interest on this subject.
Wallpaper is available for downloading for your phone or tablet.
Contact me through the links on this page.
Social Media
You can now find me on Facebook as
FractalArtAndDesign
and on Instagram under
FractalArtDesign.
I'll be posting my latest finished works here, as well as following my favorite fractal artists.
About Fractals
The word fractal roughly means “fractional dimensions,”
referring to the mathematical tendency of a fractal shape to form
somewhere “between” classical geometric dimensions.
Fractals are created by iterating a mathmatical formula,
geometric progression, or another repeating process to generate an
increasingly complex, often beautiful result.
A classic example of a simple, geometric fractal is a Koch Curve.
This fractal shape is formed by overlaying an isosceles triangle
on top of an inverted isosceles triangle of the same size, creating
a six-point star. This forms six more triangles. Repeat for each of
these triangles, and again and again... This ultimately creates a
sort of fuzzy-star shape, somewhat organic-looking. The figure shows
an example of the first two iterations of this process.
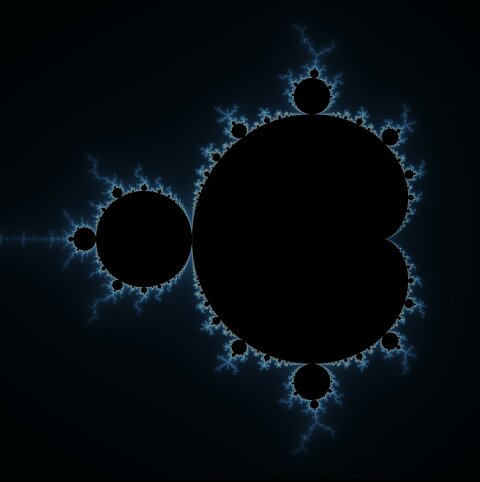
Mandelbrot Set
The Mandelbrot Set was discovered by the mathmetician
Benoit Mandelbrot at IBM in 1979. He discovered
that repeated application of a deceptively simple formula, z=z²+c
produced an increasingly complicated result. The value of z
starts at zero, and c is a complex (imaginary) number. The
“set” is those values of c where the formula
result never exceeds 2, (or “escapes”) no matter how
many times the formula is iterated.
The colorful graphics that can be generated by a computer are
created not by the points that exist in the set, but by those
outside that escape the formula. Each escape point took a certain
number of iterations of the formula to escape. Different colors can
be assigned to the different iteration counts, such as a color
gradient or an interference pattern (sine waves). Since complex
numbers consist of two axes, real and imaginary, this can be plotted
on a two-dimensional graph to create a fractal image.
Multibrot Space
The Mandelbrot set can be extended into three dimensions by
adding another variable, the exponent. This exponent is traditionally
fixed at the value two (or squared) in the Mandelbrot
formula, z=z²+c. Since c is a complex number, the results
are mapped onto a two-dimensional plane, with the real component
mapped to the horizontal axis and the imaginary component mapped to
the vertical axis.
Altering the formula to z=zn+c, we now can vary the
exponent, n. A Multibrot simply changes the
exponent to another fixed value and draws the resulting set.
However, the exponent can be mapped to a third axis, creating a
three-dimensional “Multibrot space” for further
exploration.
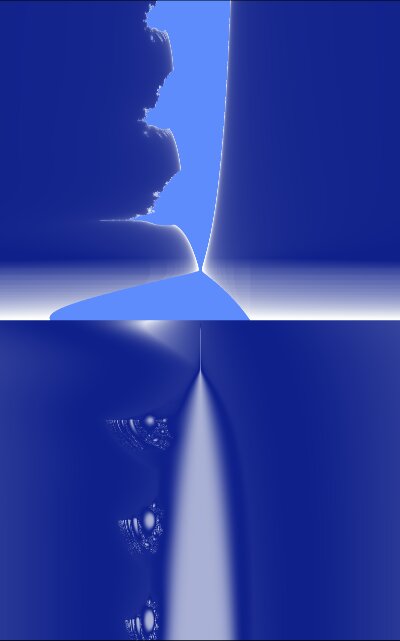
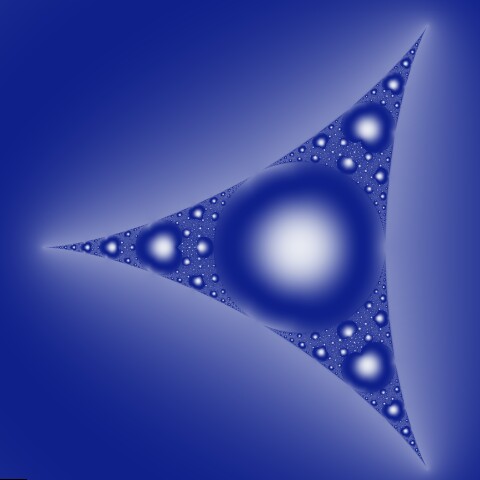
How do we explore such as space? One possibility is to define a
plane, or a “slice” through this space and calculate
the resulting set on this plane. This is the approach I have taken,
allowing a plane of arbitrary angle and position to be requested.
See the “Multibrot Slice” formula option in my
fractal generator. The image at the left is rendered with the
real value on the horizontal axis, the imaginary value fixed at zero,
and the exponent on the vertical axis.
Please see the Math and Fractal Everywhere
pages for more details.
Fractal Everywhere
This is a fractal generator application that will run everywhere, in any
modern web browser. Browser technology has advanced far enough to
allow efficient, intense number-crunching of the calculations
required to create fractals right in the browser. The application
currently renders the Mandelbrot set and variations.
This is a web-based application, so the browser matters!
It currently works best in Google Chrome.
Though this application is standards-compliant, other browsers tend to have various issues:
Chrome will throttle performance, especially in the background (though this has improved).
The old Internet Explorer 11 and the old Edge compiler is not as optimized and will swamp your CPU.
Mobile WebKit browsers may not render the fractal (blank screen).
Mac Safari may display artifacts as the rendered fractal slices are assembled.
Firefox will now also throttle performance. See Performance Notes, below.
The link below will bring you to the full version, the same
version that I use to create the pieces in the gallery. A painter
uses paints; I use a CPU. I am giving you access to my paints!
Please be aware that this is always a work in progress. It will
change at a whim.
By using this application you
agree to the following terms. This application is provided
“as-is” and “at your own risk” without
warranty as to suitability of use. I am sharing access without
asking for compensation. No support is provided. I retain complete
ownership and copyright on the code. The application does not track
usage in any way above the normal web-host statistics typical
of any and all other web sites. Your clicks and results within the
application are not recorded. Any images produced are the sole
property of the user under international copyright law. It is the
user's sole responsibility to store and preserve any results.
This CPU-intensive application will place a high demand on your
battery. If your tablet overheats from CPU load, contact the
manufacturer, not me.
Performance Notes
Browsers are taking steps to reduce the impact of CPU-intensive web pages on your web browsing experience.
If you plan on performing some serious rendering in this application, you should consider disabling the CPU
throttling in your browser.
Firefox: Enter “about:config” into the address bar and accept the warning that
comes up. Search for dom.ipc.processPriorityManager.enabled. If you don't see it, you can right-click on
the list and create it. Set it to false.
Chrome no longer allows control of this feature. However, its task management has improved
greatly. When rendering, keep the rendering tab frontmost and active for top performance. Other windows and
tabs will be de-prioritized, but they will render. Chrome handles multiple tasks very nicely now.
To draw the most performance from your CPU, enable the Performance item under the
Options menu. This is off by default.
Fractal Variations
There are multiple interesting variations of the Mandelbrot set
that arise through modifications to the underlying formula. You may
switch the formula in use under the Control pane.
Mandelbar creates a three-lobed figure by
using the complex conjugate of the traditional formula,
which calculates the real portion minus the imaginary portion.
Burning Ship calculates the absolute value
(positive only) of the formula. The result looks like a ship at sea,
on fire. Magnifying behind the “ship” reveals some tall
ships, also seemingly on fire. This pattern appears to the left
of the Multibrot set rendered with the y-axis mapped to the exponent
instead of to the imaginary component. (See Multibrot Slice,
below.)
Cubed raises the power of the formula to three,
instead of two. This creates a mirrored-image of the set, with some
interesting differences.
Multibrot* allows you to set the exponent of
the formula to something other than the traditional second power. Larger
numbers create a fringed circle effect, while non-integer values
add some interesting complications. Negative values change the
behavior altogether, and utilizes period mapping instead
of the traditional escape method.
Multibrot Slice* takes a cross-section, or
“slice,” of the multibrot set rendered in three-dimensions.
The real and imaginary components are still mapped to the x- and
y-axes, and the exponent is added for the z-axis. To take a
“slice” of this form, extra parameters are available to
define the plane of a cross-section.
This is a superset of almost all variations presented on this
page. There is so much to explore, even without changing the
parameters!
First, an Offset defines the distance of the center of
the plane from the origin (0,0,0). Angle determines the
angle of the plane from the z-axis (the exponent). Rotation
specifies the rotation of the plane around the z-axis. Angles are
in degrees, (0,0) facing “down” at a traditional
multibrot rendering, in which case the offset is equivalent to the
exponent.
It is very easy to get lost and end up with a blank screen! If
this happens, zoom out, or reduce your offset to single digits, or
Reset the parameters to start over. The active set is a
narrow, vertical column. Keep in mind that you are rotating your
thin render plane around the column, and not all solutions
intersect. At this time, the parameters rotate around the origin
(0,0,0).
Negabrot shows what occurs when the exponent
is changed to -2. This implementation utilizes the same escape
method as the Mandelbrot (though technically incorrect and somewhat
unstable).
Negabrot (Periodic) is the Negabrot variant above
rendered “correctly” using period mapping.
Tower of Powers* is a little different. It calculates the initial value c
raised to the power of the result z over and over again, z = cz,
starting with z = 1. You would think that this
would quickly escape to infinity, but there are some stable areas that produce interesting results.
This is very similar to what appears when you render the Multibrot with a very high exponent.
Newton* fractal illustrates the chaotic nature of the Newton method for iteratively
discovering the roots of a complex equation. By default, it renders in the Julia set, but things get interesting
using other rendering options. This fractal is essentially a Multibrot formula divided by its derivative.
Select an image to go directly to the live
rendering.
* Some of the formulas are more calculation-intensive
than others, and will take more time to render.
More Details
Here are some more details on this application. First, it is
designed for functionality, not to be pretty. If you're using a
tablet or mobile device, touch support is rudimentary. The primary
goals are flexibility, quality of output, and calculation speed
(more below). I am always tweaking it with these goals in mind.
Flexibility A strong, customizable theming
engine is built in for theoretically unlimited color theming of the
fractals. It supports traditional gradient (ramp) themes, sinewave-
based (wave) themes, and more complicated (and hard to manage)
interference matrices. Many presets are provided to get you started.
You can also build your own, which are saved in your browser's local
storage. Note that if you clear your browser's storage, you will
lose your themes! The theme can be applied as a linear, logarithmic,
or exponential progression (see the Render menu) to control
complexity. For finished work, the resolution can be changed to
create print-quality results. There are many other parameters that
can be fine-tuned.
The depth controls the maximum iterations allowed before
the point is considered “escaped.” Without such a maximum,
the calculation would take forever. This is automatically determined
based upon the magnification. Several presets are provided,
Moderate being the typical setting. You can also specify
this number manually in the Details pane.
Quality. Oversampling performs multiple
calculations per pixel to create a high-quality image. You can choose
from Fast calculation with no oversampling to Fine
8x8 oversampling. For most exploration, you will probably stay in
Good 2x2 oversampling for a balance of speed and quality.
The calculation overruns by three extra iterations to smooth out
banding artifacts that are typically created by an iterated process.
Preview mode temporarily turns off calculation-intensive
enhancements for quicker rendering.
For extra detail on your screen, you can enable
Subpixel
Rendering
. Most LCD screens are set up with red, green, and blue
elements arranged side-by-side on each pixel. This option takes the
positions of these elements into consideration when rendering,
effectively tripling the resolution of your display on the
Detailed and Fine quality settings.
The oversampling adjusts slightly to 6x4 and 9x8, respectively.
Note that you should turn this off when rendering for print or web.
ASM.JS
Speed. The calculation engine is fully-optimised
to run in the browser's asm.js compiler. This means that
the browser distills the core calculation into native machine code
(really fast)! The application contains its own benchmark, which
I've used to fine-tune the performance. You can adjust certain
performance parameters in the options. This application is multi-
threading, and will automatically adjust to your device's capabilities,
even if you're using a tablet.
Many factors will affect the overall speed of the rendering, CPU
power being the primary constraint. The deeper you go into a portion
of the fractal set, the more iterations are usually required to render
a result. Oversampling quality and smoothing also increase demand. You
can temporarily turn off all calculation-intensive enhancements with
the Preview option under the Quality menu.
The Performace option under the Options
menu will attempt to utilize the full capability of your CPU. Note that
some browsers (ahem, Internet Explorer) will be extra aggressive when
allocating your system's resources. By default, this option is not turned
on to give your system some breathing room to operate other tasks.
Extended Precision for Deep Zoom
This application supports double-double-precision math
for zooming in beyond the CPU's double-precision limit. Normally, the
image will degrade into blocks if you zoom in too far; you've hit
the precision limit of your computer when this happens. This
application will automatically switch to extended precision
when you hit this limit. This requires extra computation, however,
and results in the calculation slowing down dramatically. You
will see a brief notification when this occurs, and there is a
“Precision” indicator in the “Details”
panel that will switch from “Standard” to
“Extended.” I'd recommend lowering
the quality setting to “Fast” when exploring
this deep. Expect long render times for finished fractals.
At this time, the formulas that require trigonometry don't yet
support extended precision. The application will notify you if
it can't do it. You can currently zoom deep into the Mandelbrot,
Mandelbar, Burning Ship, and Cubed variations. Eventually it
will have support for all variations.
Various Tips
You can save the browser's URL at any time to a bookmark in
your web browser to remember the current fractal displayed. The
displayed coordinates are compatible with any other Mandelbrot
set application, however, the options in the URL are
unique to this application. The Save Location
option under the Options menu
will automatically
remember where you were when you come back later. Note that a
saved URL (bookmark) will override this option.
Printing a rendering usually requires higher
resolution output than your screen. You can manually set the pixel
width and height through the Resolution setting on the
Details pane. You will want to calculate the target width
and height by multiplying the paper size by the desired DPI.
Gamma is usually set to 1. If you are rendering
for a print, you may wish to change this to around 1.2.
Resolution defaults to your web browser window
size, or the screen size of your mobile device. With Auto Render
enabled under the Options, your fractal will
automatically re-render if your window size changes. This includes
any bars that appear along the bottom of the window. To prevent
this, click on the Set or Screen link under the
Resolution setting to fix the resolution, ignoring resize events.
Saving your rendering is best achieved by
right-clicking on the image and selecting the option to save the
image from the menu. If your browser responds to the right-click by
sending a regular click to the application, click Lock Coords
above the coordinates first. A Save Image link appears
on the Details pane when rendering completes, but this is
memory-intensive and has limited support by the browsers. Note that
some browsers will show a status bar at the bottom once you save an
image, triggering a resize (and re-render) on the window. On mobile
devices, use the Full Screen and Hide Controls
options to clear all user interface elements, then take a screenshot.
Settings and custom themes are saved in your
browser's local storage.
If you clear this, all of your customization
will disappear.
There is no export function. However, custom themes
are copied into the URL on the Coordinates link, so if
you have saved a bookmark, your theme will be preserved. I take pains
during development to honor older bookmarks so they always work.
Fractal App for Android
Note: The latest version of Android Web View has a display issue on some
devices. The display will not update properly and you may see a blank screen, or
a partial rendering. We have to wait for Google to fix the issue.
I've created a simple container app for Android that runs my fractal
application on your smartphone or tablet. The advantage of this is that it is available
offline at any time, and it remembers your place. The app version is simplified, as it
is not running in a full web browser. There are buttons along the bottom to launch your
work in the device's web browser, copy the URL to the clipboard, copy the clipboard back
into the app, and to enter fullscreen mode on the device. It does not have capability to
save the image at this time (use the device's screenshot capability).
This app is not “official” and is not available in any app store. It is
available “as-is” from this web site only. You must enable your device's
ability to install apps from outside sources. I do not have an Apple
development environment, so I don't plan on developing an iDevice version.
This is a work in progress.
Tip: Access the latest updates by clearing the app's data on the
device, then launching the app while connected to the Internet. Note that this will
lose your place. Do this through the device's application management settings.
Alternatively, you can uninstall and reinstall the app.
Math & Art
Wait, “Math” and “Art?”
If you've come this far, you may be thinking twice about these
apparent opposites. Yes, it's possible for the two to coexist and
even complement each other.
This is a space to discuss various topics that don't fit
elsewhere regarding art, math, programmatic details, etc. I
hope you find this interesting. Chances are, you arrived here
through a search result. If so, please explore the rest of the
site! I plan to add more to this page as my exploration
continues in this area.
When creating fractal art, the computer does all the work. Really,
You press a button and out comes an image. You may be asking,
how is this art?
The art is in the painstaking preparation. For example,
an exquisite bronze sculpture is created when a metal foundry pours
molten metal into a cast. The metal cools, the cast is opened, and
the sculpture is there! It isn't that simple, though. An artist had
to create the cast.
Computer-generated art requires an artist to set up the parameters.
This requires careful exploration of the fractal space and fine
adjustment of form and color. Like photography, framing and lighting
are critical. It can take several hours (or days!) to create something
that's worth rendering to print.
To continue the bronze sulpture metaphor, multiple copies of the
sculpture can be created simply by reusing the mold. This reduces
the value of each copy, unless the mold is broken after the
first successful cast. This creates a one-of-a-kind piece of work.
The same can be done with fractal art. If only one print is
created from the work, and the parameters are never shared, then
the work becomes unique. It's possible to “break the mold”
by securing or even deleting the parameters file and the
rendered image file after printing. These become
single-edition prints.
I have not had the courage to hit the delete button after
finishing a work. The prints are one-of-a-kind, yet the original
fractal provides opportunity for continued study. Unlike a mold,
it is still a “living” work of art that can be explored
further.
Motion
Creating moving art with fractals involves gradually changing one or more of the values
that affects the underlying fractal formula, as well as the method used to render the
fractal such as the approach to color the fractal form.
Possible Parameters
X and Y coordinates in the complex plane
The exponent e in the formula, z = ze + c
When slicing through "multibrot" space, the slice angle and position
Coloration using the red, green, and blue channels of each rendered pixel
There are two methods of rendering a moving fractal: rendering to video or real-time
generation. With a modern graphics processing unit (GPU) that is built-in to today's
computers and devices, it is possible to generate motion in real-time on nearly any device.
Higher complexity, such as varying the exponent in a trigonometric fractal, requires more
capable devices such as the Layer Frame.
This is the next natural step for development of my fractal program, as all the components
are in place. I have a little development to do...
Perturbation Theory
Perturbation Theory has been around for a while, and it is a method for
figuring out the results of an unknown relationship by calculating known relationships
around it, then using the differences (or perturbations) as a means to get to the unknown value. See
Wikipedia - Perturbation Theory
for more information.
How does this apply to fractals? In March of 2013,
Kevin Martin published a paper
explaining a theoretical method to apply perturbation theory to the calculation of the
Mandelbrot set. Application of the theory promised a couple of significant advantages:
You only have to iterate once, leveraging the values collected during the
iteration of a single sample point to figure out all the rest of the points in the fractal.
All calculations are performed using standard double-precision floating-point processing,
no matter how deep the zoom. There is no need to exotic extended-precision math.
These two advantages would eliminate the “brute force” technique traditionally
utilized to render fractals, which requires million or billions of iterations of the fractal formula. By
iterating just one point, the rest of the fractal could be rendered simply by leveraging the data
collected, calculating perturbations for all the points around that reference point.
In practice, more reference points are needed for complex areas of the fractal, but this usually
results in only a handful of fully-iterated points being calculated.
The pertubation formulas for the Mandelbrot set cancel out the need for
ultra-precise floating-point numbers when zooming into the fractal beyone 1015
magnification. All calculations can be performed natively on any computer's floating-point
processor for any zoom level. This eliminates the breakdown or blockiness that occurs in
deep zooms, as well as the need for CPU-intensive extended-precision techniques, and opens
up the ability for nearly-unlimited zoom into a fractal.
The result: nearly real-time rendering with unlimited zoom!
Multiple existing fractal applications have already taken advantage of this theory and have implemented
it. I am late to the game, and am currently working on implementing it for my own project. At this time,
my application does not utilize perturbation methods, and relies on the brute-force
iteration method. This will change.
Why do this if others have already done it? I am doing this to learn-by-doing,
to enjoy the process of figuring this out, and to build my artistic toolset. By building it myself, I
gain a better understanding of the subject and can better create art.
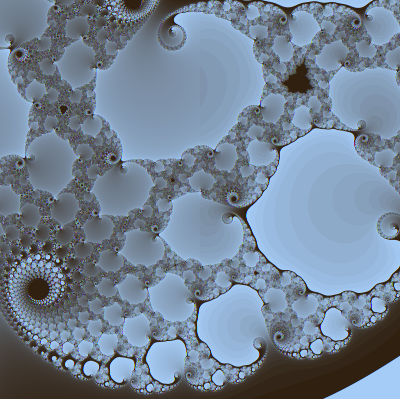
Smoothing
Calculating a Mandelbrot-type fractal requires counting the
iterations required for the formula to escape beyond
a predefined value. This results in integer values, which when
mapped produces a marked “banded” effect. A little
calculus allows us to figure out how these bands are progressing
overall and to smooth out the quantization effect of an iterating
formula. This image shows the difference, the right half of the
image being unenhanced.
The iteration cycles must overshoot beyond the escape
value a few times to collect enough samples for smoothing.
This is a small price to pay for a more finished result.
Period-Mapping
Rendering negative exponents “breaks” traditional
escape-time rendering of the inside of the set. Instead,
periodic rendering must be utilized to render under
negative exponents. Typically, this requires time-consuming
sampling of many iterations for each point. However,
Aleksandr Lyapunov
developed a methodology to determine period-calculation without
such sampling.
Applying Lyapunov's work to the Multibrot universe, the calculation
is fairly simple: take the natural logarithm of the average result
and divide by the number of iterations run. No sampling, just apply
a formula to the final figures. We can collect the sum over the
iteration process without much extra CPU work.
Implementing this into a computer program, I realized that the
formula can be simplified, I mean really simplified, with
the goal of a satisfying visual result. The final periodic
calculation used by this application resolves the average
magnitude of a set of vectors. This provides a visual texture of
the periodicity inherrent to negative exponents. My piece
Sunset on Ice
is an example of how complex this texture can become.
Simplified Periodic Formula
1
(∑r² + ∑i²) ÷ iterations + 1
Since we are already calculating these squares as a matter of
building the fractal, collecting the sums is a trivial addition
(no pun intended). Adding one to the denominator avoids a runaway
result to infinity for vector lengths close to zero. On the other
hand, the inversion inhibits runaway values in the other
direction. The overall magnitude of the result can be controlled
by changing the constant numerator from one to another value.
These calculations are leveraged for optional effect-rendering
on the inside of the set for positive exponents, and the outer
area for negative exponents. Period-rendering can be
applied at any time in my application through the Render
menu. Also, variations of the effect can be selected through the
Effect menu. The application can render both escape-time
and period-mapping at the same time for interesting
results. Try it with the trigonometric variants of the Mandelbrot
fractal.
See the Wikipedia articles linked in the Resources
section for more detail about smoothing and period-mapping.
Resources
Here are a few additional resources for more information.
 The Mandelbrot Set was discovered by the mathmetician
Benoit Mandelbrot at IBM in 1979. He discovered
that repeated application of a deceptively simple formula, z=z²+c
produced an increasingly complicated result. The value of z
starts at zero, and c is a complex (imaginary) number. The
“set” is those values of c where the formula
result never exceeds 2, (or “escapes”) no matter how
many times the formula is iterated.
The Mandelbrot Set was discovered by the mathmetician
Benoit Mandelbrot at IBM in 1979. He discovered
that repeated application of a deceptively simple formula, z=z²+c
produced an increasingly complicated result. The value of z
starts at zero, and c is a complex (imaginary) number. The
“set” is those values of c where the formula
result never exceeds 2, (or “escapes”) no matter how
many times the formula is iterated.
 How do we explore such as space? One possibility is to define a
plane, or a “slice” through this space and calculate
the resulting set on this plane. This is the approach I have taken,
allowing a plane of arbitrary angle and position to be requested.
See the “Multibrot Slice” formula option in my
fractal generator. The image at the left is rendered with the
real value on the horizontal axis, the imaginary value fixed at zero,
and the exponent on the vertical axis.
How do we explore such as space? One possibility is to define a
plane, or a “slice” through this space and calculate
the resulting set on this plane. This is the approach I have taken,
allowing a plane of arbitrary angle and position to be requested.
See the “Multibrot Slice” formula option in my
fractal generator. The image at the left is rendered with the
real value on the horizontal axis, the imaginary value fixed at zero,
and the exponent on the vertical axis.
 Fractal Everywhere
 When creating fractal art, the computer does all the work. Really,
You press a button and out comes an image. You may be asking,
how is this art?
When creating fractal art, the computer does all the work. Really,
You press a button and out comes an image. You may be asking,
how is this art?
 Creating moving art with fractals involves gradually changing one or more of the values
that affects the underlying fractal formula, as well as the method used to render the
fractal such as the approach to color the fractal form.
Creating moving art with fractals involves gradually changing one or more of the values
that affects the underlying fractal formula, as well as the method used to render the
fractal such as the approach to color the fractal form.
 Calculating a Mandelbrot-type fractal requires counting the
iterations required for the formula to escape beyond
a predefined value. This results in integer values, which when
mapped produces a marked “banded” effect. A little
calculus allows us to figure out how these bands are progressing
overall and to smooth out the quantization effect of an iterating
formula. This image shows the difference, the right half of the
image being unenhanced.
Calculating a Mandelbrot-type fractal requires counting the
iterations required for the formula to escape beyond
a predefined value. This results in integer values, which when
mapped produces a marked “banded” effect. A little
calculus allows us to figure out how these bands are progressing
overall and to smooth out the quantization effect of an iterating
formula. This image shows the difference, the right half of the
image being unenhanced.
 Rendering negative exponents “breaks” traditional
escape-time rendering of the inside of the set. Instead,
periodic rendering must be utilized to render under
negative exponents. Typically, this requires time-consuming
sampling of many iterations for each point. However,
Rendering negative exponents “breaks” traditional
escape-time rendering of the inside of the set. Instead,
periodic rendering must be utilized to render under
negative exponents. Typically, this requires time-consuming
sampling of many iterations for each point. However,